Shen, J. et al. SHEsisPlus, a toolset for genetic studies on polyploid species. Sci. Rep. 6, 24095; doi: 10.1038/srep24095 (2016).
Shi, Y. et al. SHEsis, a powerful software platform for analyses of linkage disequilibrium, haplotype construction, and genetic association at polymorphism loci. Cell Res. 15, 97–98; doi: 10.1038/sj.cr.7290272 (2005).
Li, Z. et al. A partition-ligation-combination-subdivision EM algorithm for haplotype inference with multiallelic markers. Cell Res. 19, 519–523; doi: 10.1038/cr.2009.33 (2009).
if you find this tool useful in your research. Thanks!
Single Locus Association Test (Binary phenotype):
Alleles:
SNP
Call rate
Chi2
Pearson's p
Fisher's p
OR [95% CI]
Holm
SidakSS
SidakSD
FDR_BH
FDR_BY
Detail
rs1800497
1
0.04
0.839
0.901
1.051 [0.646~1.711]
1
0.999
0.974
0.918
1
	G	A
Case	73(0.579)	53(0.42)
Control	84(0.591)	58(0.408)
rs4633
1
0.446
0.504
0.555
1.217 [0.682~2.171]
1
0.999
0.939
0.693
1
	C	T
Case	96(0.761)	30(0.238)
Control	113(0.795)	29(0.204)
rs4680
1
0.276
0.598
0.66
1.166 [0.656~2.072]
1
0.999
0.939
0.732
1
	G	A
Case	96(0.761)	30(0.238)
Control	112(0.788)	30(0.211)
rs8192620
1
5.415
0.019
0.026
0.538 [0.318~0.909]
0.199
0.198
0.182
0.109
0.331
	C	T
Case	32(0.253)	94(0.746)
Control	55(0.387)	87(0.612)
rs482951
1
2.27
0.131
0.22
NA [NA~NA]
0.714
0.788
0.532
0.207
0.625
	G	C
Case	124(0.984)	2(0.015)
Control	142(1)	0(0)
rs2280506
1
2.428
0.119
0.128
1.54 [0.893~2.659]
0.714
0.752
0.532
0.207
0.625
	C	T
Case	39(0.309)	87(0.69)
Control	32(0.225)	110(0.774)
rs2280507
1
3.37
0.066
0.072
1.665 [0.963~2.878]
0.596
0.53
0.46
0.162
0.491
	C	T
Case	86(0.682)	40(0.317)
Control	111(0.781)	31(0.218)
rs6744273
1
3.371
0.066
0.074
1.658 [0.964~2.851]
0.596
0.529
0.46
0.162
0.491
	G	A
Case	41(0.325)	85(0.674)
Control	32(0.225)	110(0.774)
rs13538
1
NA
NA
NA
NA [NA~NA]
NA
NA
NA
NA
NA
	A
Case	126(1)
Control	142(1)
rs5751876
1
3.193
0.073
0.086
1.551 [0.957~2.515]
0.596
0.57
0.46
0.162
0.491
	C	T
Case	67(0.531)	59(0.468)
Control	60(0.422)	82(0.577)
rs11030104
1
0.01
0.918
1
0.975 [0.601~1.579]
1
0.999
0.974
0.918
1
	G	A
Case	70(0.555)	56(0.444)
Control	78(0.549)	64(0.45)
Genotypes:
SNP
Chi2
Pearson's p
Fisher's p
Holm
SidakSS
SidakSD
FDR_BH
FDR_BY
Detail
rs1800497
0.084
0.958
0.971
1
0.999
0.958
0.958
1
	G/G	A/A	G/A
Case	20(0.317)	10(0.158)	33(0.523)
Control	23(0.323)	10(0.14)	38(0.535)
rs4633
1.566
0.456
0.498
1
0.998
0.815
0.502
1
	C/C	C/T	T/T
Case	39(0.619)	18(0.285)	6(0.095)
Control	45(0.633)	23(0.323)	3(0.042)
rs4680
1.686
0.43
0.441
1
0.997
0.815
0.502
1
	G/G	A/A	G/A
Case	39(0.619)	6(0.095)	18(0.285)
Control	44(0.619)	3(0.042)	24(0.338)
rs8192620
5.159
0.075
0.082
0.757
0.579
0.545
0.33
0.998
	C/T	T/T	C/C
Case	20(0.317)	37(0.587)	6(0.095)
Control	31(0.436)	28(0.394)	12(0.169)
rs482951
2.288
0.13
0.219
1
0.784
0.715
0.33
0.998
	G/G	G/C
Case	61(0.968)	2(0.031)
Control	71(1)	0(0)
rs2280506
2.55
0.279
0.273
1
0.972
0.743
0.384
1
	C/T	T/T	C/C
Case	27(0.428)	30(0.476)	6(0.095)
Control	26(0.366)	42(0.591)	3(0.042)
rs2280507
3.426
0.18
0.184
1
0.887
0.743
0.33
0.998
	C/T	T/T	C/C
Case	28(0.444)	6(0.095)	29(0.46)
Control	25(0.352)	3(0.042)	43(0.605)
rs6744273
3.534
0.17
0.177
1
0.872
0.743
0.33
0.998
	G/A	A/A	G/G
Case	27(0.428)	29(0.46)	7(0.111)
Control	26(0.366)	42(0.591)	3(0.042)
rs13538
NA
NA
NA
NA
NA
NA
NA
NA
	A/A
Case	63(1)
Control	71(1)
rs5751876
3.713
0.156
0.179
1
0.845
0.743
0.33
0.998
	C/C	T/T	C/T
Case	18(0.285)	14(0.222)	31(0.492)
Control	11(0.154)	22(0.309)	38(0.535)
rs11030104
2.942
0.229
0.234
1
0.943
0.743
0.36
1
	G/A	G/G	A/A
Case	34(0.539)	18(0.285)	11(0.174)
Control	28(0.394)	25(0.352)	18(0.253)
Hardy-Weinberg Equilibrium Test:
SNP
Chi2 in case
Pearson's p in case
Fisher's p in case
Chi2 in ctrl
Pearson's p in ctrl
Fisher's p in ctrl
Chi2 in both
Pearson's p in both
Fisher's p in both
rs1800497
0.351
0.838
0.913
0.821
0.663
0.894
1.13
0.568
0.84
rs4633
2.844
0.241
0.469
8.00e-04
0.999
1
1.589
0.451
0.629
rs4680
2.844
0.241
0.469
0.014
0.992
1
1.288
0.524
0.659
rs8192620
1.658
0.436
0.702
0.454
0.796
0.922
2.335
0.311
0.607
rs482951
5.16e-04
0.981
1
0
1
1
1.13e-04
0.991
0.999
rs2280506
4.43e-04
0.999
1
0.169
0.918
0.955
0.032
0.984
1
rs2280507
0.041
0.979
1
0.071
0.965
1
0.032
0.984
1
rs6744273
0.035
0.982
1
0.169
0.918
0.955
6.35e-04
0.999
1
rs13538
0
1
NA
0
1
NA
0
1
NA
rs5751876
0.008
0.995
1
0.664
0.717
0.897
0.143
0.93
0.96
rs11030104
0.543
0.762
0.914
2.941
0.229
0.434
0.555
0.757
0.839
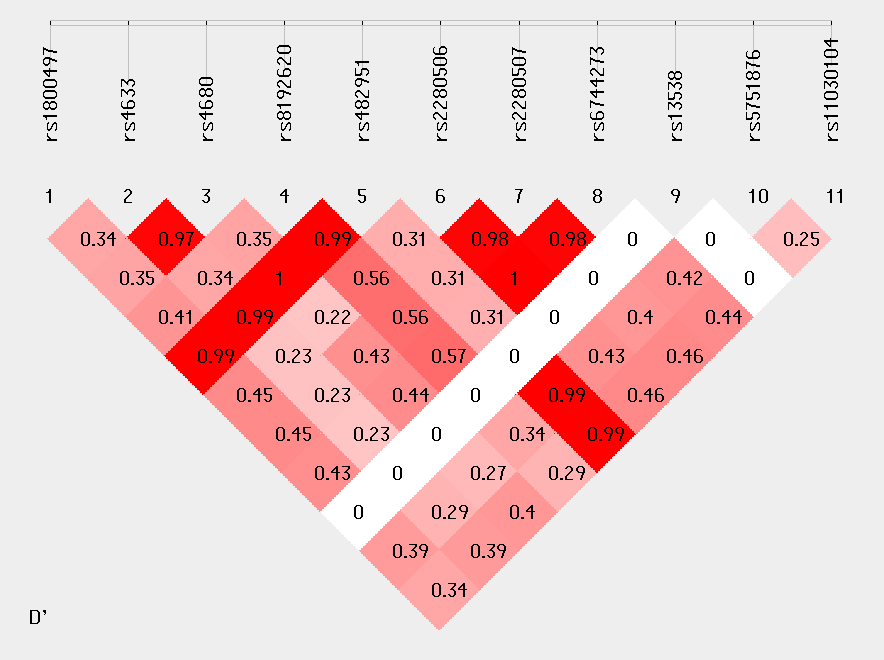
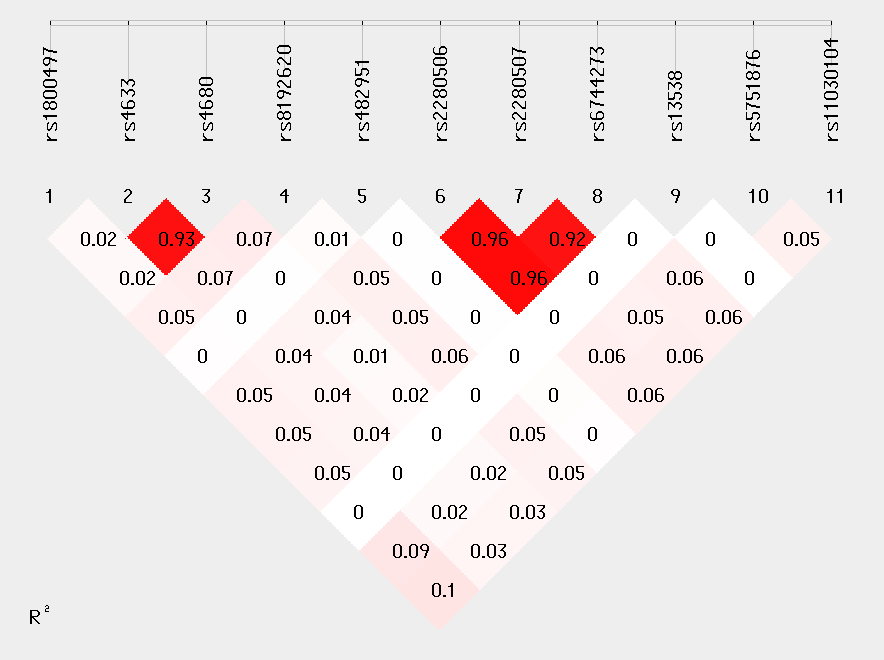
Haplotype Analysis:
Haplotypes with frequency <0.03 are ignored. Loci chosen for haplotype analysis: rs1800497, rs4633, rs4680, rs8192620, rs482951, rs2280506, rs2280507, rs6744273, rs13538, rs5751876, rs11030104
Haplotype
Case(freq)
Control(freq)
Chi2
Fisher's p
Pearson's p
OR [95% CI]
Holm
SidakSS
SidakSD
FDR_BH
FDR_BY
GCGTGTCAACA
5(0.039)
4(0.028)
0.272
0.738
0.601
1.425 [0.374~5.429]
1
1
0.99
0.651
1
ACGTGTCAACG
7(0.055)
7(0.049)
0.052
0.999
0.818
1.134 [0.386~3.328]
1
1
0.996
0.834
1
ACGTGTCAATA
7(0.055)
4(0.028)
1.272
0.357
0.259
2.029 [0.579~7.102]
1
0.999
0.963
0.321
1
GTACGTCAATA
6(0.047)
4(0.028)
0.703
0.523
0.401
1.725 [0.475~6.257]
1
0.999
0.99
0.455
1
ACGTGTCAACA
11(0.087)
14(0.098)
0.1
0.834
0.751
0.874 [0.381~2.003]
1
1
0.996
0.797
1
GCGTGTCAATG
9(0.071)
9(0.063)
0.069
0.811
0.792
1.136 [0.436~2.959]
1
1
0.996
0.824
1
GCGTGTCAACG
7(0.055)
8(0.056)
7.74e-04
0.999
0.977
0.985 [0.346~2.798]
1
1
0.996
0.977
1
ACGCGTCAATA
3(0.023)
6(0.042)
0.699
0.507
0.402
0.552 [0.135~2.258]
1
0.999
0.99
0.455
1
GCGTGCTGACG
11(0.087)
3(0.021)
5.904
0.024
0.015
4.431 [1.207~16.266]
0.196
0.546
0.179
0.019
0.089
ACGTGTCAATG
6(0.047)
10(0.07)
0.618
0.454
0.431
0.66 [0.232~1.87]
1
0.999
0.99
0.477
1
GCGCGTCAATG
3(0.023)
6(0.042)
0.699
0.507
0.402
0.552 [0.135~2.258]
1
0.999
0.99
0.455
1
GCGTGTCAATA
3(0.023)
7(0.049)
1.207
0.343
0.271
0.47 [0.119~1.859]
1
0.999
0.963
0.328
1
GTACGTCAATG
1(0.007)
8(0.056)
4.819
0.038
0.028
0.134 [0.016~1.086]
0.337
0.773
0.29
0.035
0.161
Global result: Total control=71, total case=63. Global Chi2 is 15.722, Fisher's p is NA, Pearson's p is 0.204.